Data stories: What the class picked

Here are the data stories that class members picked to talk about. I’m linking to all of them here so we can discuss on Wednesday. Each of you can talk about your own selection and explain why you picked it, what makes it a “data-driven” story and what you took away from it.

Myles: 

The Guardian: Young voters, class and turnout: how Britain voted in 2017

Snapshot of the election blog.
General election coverage in data blog at The Guardian’s website.

Zahara:

Washington Post: America’s chaotic, crazy, challenging, great, tumultuous, horrible, disappointing year/  A look back at the ups and downs of public opinion in 2017.

Screenshot of WaPo's year in review online.
The Washington Post’s year in review package.


Olivia:

CDC: Autism Spectrum Disorders data

Screenshot of CDB autism disorder data page.
CDB’s website for data on autism.

Josh:

World.LiveUAMap: Russian Ministry of Defense shows photos … 

Liveuamap

Chanel:

New York Times:  How Effective Is Your School District? A New Measure Shows Where Students Learn the Most

Screenshot of NYT schools project online.
New York Times UpShot project on schools.


Safa:

New York Times: Can requiring people to work make them healthier?

Screenshot of NYT story on work and health.
New York Times story in UpShot on work and healthfulness.

Noor:

NPR: Veteran Sues After Scalpel Found Inside His Body 4 Years After Surgery


Screenshot of NPR story.
NPR story about a lawsuit over a scalpel left inside a patient and found four years later.

Zeinab and Aya:

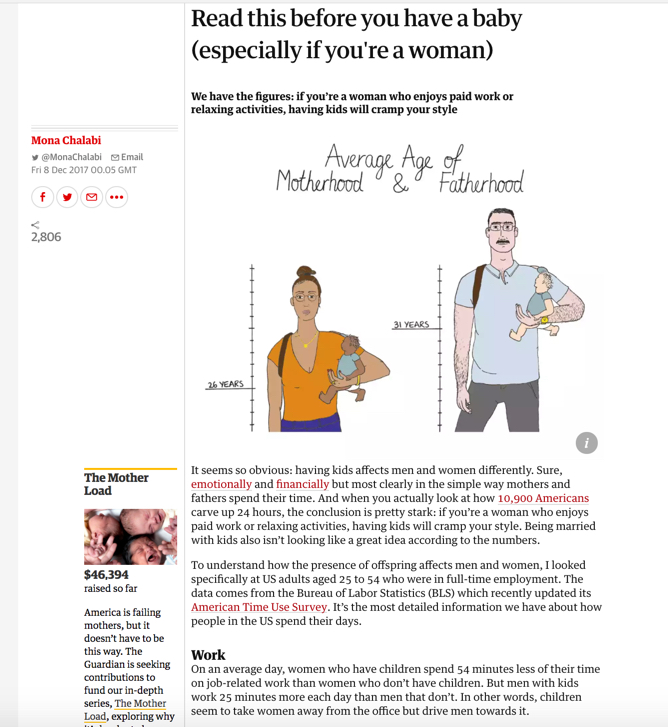
The Guardian: Read this before you have a baby (especially if you’re a woman)

Screenshot of Guardian series.
Guardian story on the impact of motherhood on lifestyle and choices in the United States.

Ashley:

New York Times: Why it’s still worth getting a flu shot

Screenshot of the image from the NYT article.
New York Times story on flu vaccines and whether they are worthwhile to get.

Eric:

New York Times:  Where Athletes in the Premier League, the N.B.A. and Other Sports Leagues Come From, in 15 Charts

Screenshot of NYT sports package.
New York Times data package in athletes from throughout the world.


Travis:

Coinmarketcap.com: Crytocurrency market capitalizations

Screenshot of bitcoin chart.
Database shows crytocurrency rates.

Jennifer:

New York Times: Why trying new things is so hard to do

Screenshot of NYT story with image.
New York Times story on why trying things can be hard.

Author: Nancy Hanus

Nancy Hanus is a journalist, digital strategist and educator. She formerly was director of digital strategy and audience development at Crain's Detroit Business and Crain's Cleveland Business; regional editor at Patch.com; and director of new media at The Detroit News.

One thought on “Data stories: What the class picked”

Leave a Reply

Fill in your details below or click an icon to log in:

WordPress.com Logo

You are commenting using your WordPress.com account. Log Out /  Change )

Facebook photo

You are commenting using your Facebook account. Log Out /  Change )

Connecting to %s

%d bloggers like this: