Journalism course breeding a skilled pre-med

Though I am not going into journalism, when I took this course I didn’t know that I would come out of it with so much knowledge in how to use different tools. These tools are not reserved for journalists only- I will not let them be.

I am going to take advantage of writing data stories. When I choose to do a write up on new data that comes out about the blood sugar of Americans and its corresponding medication Actos, I will make sure to stick to the facts just like I learned and let the results do the talking. I can even aggregate other sources within my data story to keep my fellow pre-meds up to date across the board on other relevant medical information.

My first data story about Michigan school comparisons.

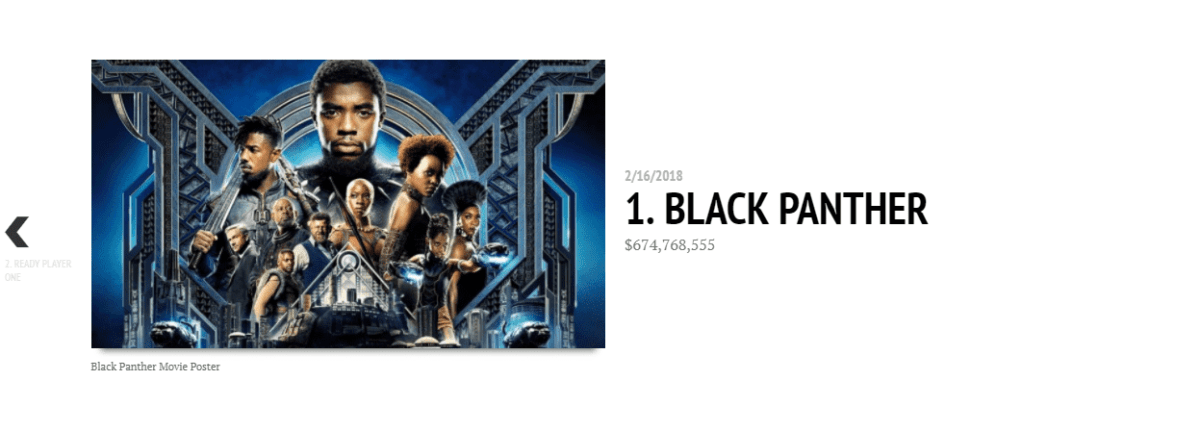
Another tool I’m thankful for is Timeline JS. I remember how hard I thought constructing my first timeline was, but now I can easily see myself in the future using it as a presentation template. Timeline JS has gotten to be easy for me and I can stir up a quick timeline in minutes.

Coding is something I’ve always wanted to learn, and this course also fulfilled that wish. Now thanks to Code Academy I can do any basic coding and this can also help in presentations and who knows what other doors it might open up in the medical field. Technology and medicine always go great together.

Overall, there is important and useful information to learn everywhere we look. Now it is just up to us as to what we do with that information!

Timeline JS Box Office Summary

I created a Timeline JS about which movies topped the box office in the year so far. You will see in the timeline that Fifty Shades Freed came in fifth place, A Quiet Place in fourth, Peter Rabbit in third, Ready Player One in second, and Black Panther in first place.

It is no surprise to be that Blank Panther is doing so good on the charts, people are in love with all the movie has to offer through experience. Whether it’s the soundtrack, picture, or actors it welcomes every viewer to a good time. It is also revolutionary because this is the first black superhero with their own movie. The Black Panther made history.

Displaying it within my timeline was neat because with a timeline everything is organized and suspenseful in a way. With my box office summary, we are anticipating to see who took the number one spot.

Drug overdoses in the U.S. in an aggregated data story

In my past data story assignment, I chose to write about how drug overdose fatalities have piled up in the United States. It was a very eye opening  topic and the data I aggregated within my story was fascinating. It goes to show how much work really needs to be done to stop people from dying everyday from drugs in our country.

  1. One of the sources I used in aggregation was data that was gathered from a study that kept track of how many students and from which specific backgrounds were offered drugs while in school. This was frightening to know that young high school students could get drugs so easily. The easier it is to get a hold of it, the easier it is to use it, the easier it is to get addicted.

    Data shows prevalence of drugs on school grounds.
  2. Another source I like was an article that was written off the Center for Disease Control and Prevention’s data set on the ranking of the most-used drugs in overdose. This article basically dumbed-it-down for me and helped me further my data story.

    Article helps understand data set on drugs used in overdoses.
  3. My favorite source was, of course, one with a visual. It summarized all I needed to know about the drug issue’s statistics through the U.S. Department of Health and Human Services.

    Visual on drug use in the U.S.

My aggregation accounts

Social media helped me gather different types of information from a variety of places like when I scroll down my Twitter feed. As I read from post to post, I can be going from news on what’s topping the box office and then the next post can be something about President Trump.

Social media like Twitter is useful to filter all your interests into one place or in this case, feed.

Currently, I’m trying to organize my Tweet Deck to suit my taste. Right now I have different sections that include feeds anywhere from food to the recent shooting at YouTube headquarters.

jass37-e1522835270941.png
My current Tweet Deck layout.

Tweet Deck helps me find different news outlets that I wouldn’t have otherwise come across such as TIME’s page. After visiting their profile, I am able to find even more relevant articles that spark my interest.

TIME has 15.5 million followers that stay updated on their news posts. If easily accessible social media like Twitter doesn’t keep people updated, I don’t know what will.

AJ+ delivers important information in easiest ways

The news outlet AJ+ is known for their pages on Twitter and Instagram is worth the follow. AJ+ states they are, “news for the connected generation, sharing human struggles and challenging the status quo.”

Gathering 892,000 followers, AJ+ delivers jam-packed news into easily accessible posts that often formats the news into video presentations.

In a generation like this one, everything is so fast-paced and needy for convenience if news isn’t efficiently presented, many people won’t bother reading it. That’s why innovative news outlets like AJ+ succeed.

I personally enjoy following them because a trust that the news is accurate and it doesn’t hurt that it’s more of a visual interaction story rather than reading through a long article.

Many minorities are represented on AJ+ which is another reason I like following them. AJ+ doesn’t shy away from being the voice to minorities in this country or even the less fortunate outside the country.