
In my past data story assignment, I chose to write about how drug overdose fatalities have piled up in the United States. It was a very eye opening topic and the data I aggregated within my story was fascinating. It goes to show how much work really needs to be done to stop people from dying everyday from drugs in our country.
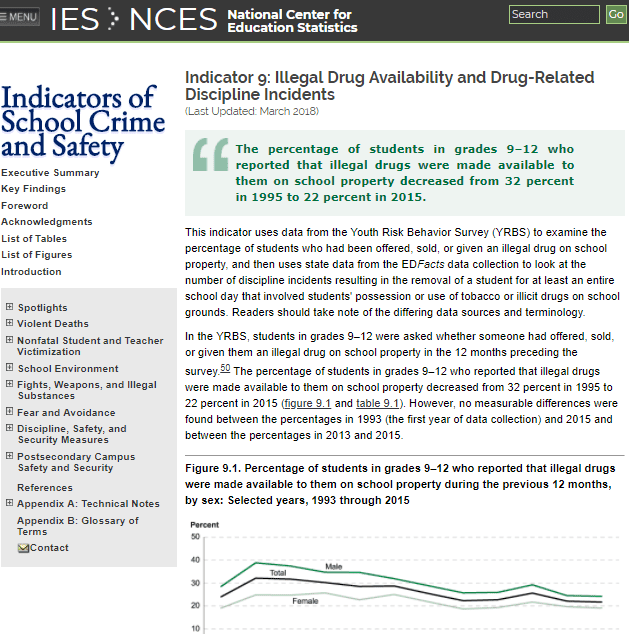
- One of the sources I used in aggregation was data that was gathered from a study that kept track of how many students and from which specific backgrounds were offered drugs while in school. This was frightening to know that young high school students could get drugs so easily. The easier it is to get a hold of it, the easier it is to use it, the easier it is to get addicted.
Data shows prevalence of drugs on school grounds. - Another source I like was an article that was written off the Center for Disease Control and Prevention’s data set on the ranking of the most-used drugs in overdose. This article basically dumbed-it-down for me and helped me further my data story.

Article helps understand data set on drugs used in overdoses. - My favorite source was, of course, one with a visual. It summarized all I needed to know about the drug issue’s statistics through the U.S. Department of Health and Human Services.

Visual on drug use in the U.S.
