

Now that I know what data stories are, I’m seeing data everywhere. After watching a movie I think about its ratings, budget, crew demographics, and anything else that can be organized in an excel sheet. I feel enlightened as if I have just taken a stats class.
I also am interested in data stories more, like the one by The Guardian that informs readers on just how much time is invested in raising a child titled, “Read this before you have a baby (especially if you’re a woman).”

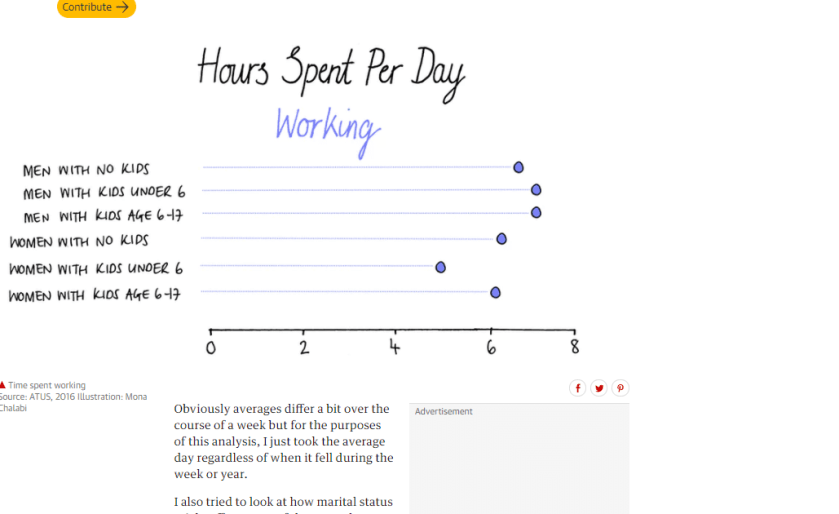
This data story provides many visuals organizing data like how many hours a day are spent working. This compares the hours of men with no kids to women with kids age 6-17.
The next data table presents the amount of hours parents spend per day watching TV. This is a way to break the news that when people have kids, their leisure time goes down dramatically like that of women with kids under the age of 6.

Data stories like this help readers visualize data easily and data can then persuade the audience if that’s what the author is trying to do.
