Google Fusion Tables and the Michigan voter turnout

Gathering data off of the internet and arranging it into easily digestible information is an important tool for journalism online. This week we took a look at the Secretary of State’s voter turnout rate for the 2016 election, and turned it into an interactive map using Google Fusion Tables.

The first step was to take the data set from the SOS website and format it leaving only the information we needed.

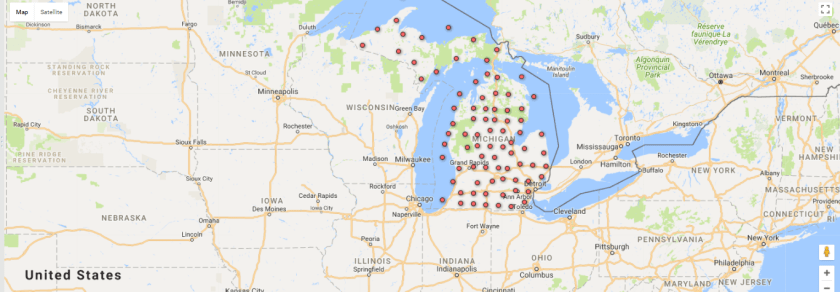
Then uploading it to Google Fusion Tables we get a map of our data that looks like this.

Screenshot (23)


The map is interactive and will allow the user to click on each individual county to find out the voter turnout for that area.

My introduction to Google Fusion Tables

This week, I took on a new challenge and the outcome was a Google Fusion Table. Google Fusion Tables is a useful tool that gathers data into an organized visual. In my opinion, this is the way I prefer to see data. Data can usually be confusing and hard to read or understand, but when it’s in some kind of chart or picture it instantly becomes easier on the eyes.

I chose to mimic a Fusion Table we practiced in class based on the 2016 Michigan voter turnout organized by county off the Michigan Secretary of State website.

With the data available on the website, I was able to download it onto my computer and then upload it up on Google Fusion Tables.

This is the data downloaded off the Secretary of State website.

After letting Google Fusion Tables do it’s magic, I got a literal map of my data. Voter turnout was shown geographically by each county in Michigan.

Google Fusion Table map of voter turnout by county in Michigan.

Google Fusion Tables is a tool I am happy to have explored. It will help my readers and I in understanding data and furthermore, allow us to not be intimidated by any complicated spreadsheets that hide beneficial information!

Four-year university tuition rates in Michigan

A comparative report was released of in-state tuition rates of the 16 four-year universities in Michigan.

Tuition and fees remain in the $7,500 through $15,500 range rising from $15,400 to $26,800 for total costs.

In-district room and board at the University of Michigan – Dearborn is the lowest in the state at $1,600. However, the University of Michigan – Ann Arbor has the highest room and board, with an average of $9,468.

School that have transportation fees would include bus systems and others. Michigan state has the average amount spent towards transportation as $498 and the University of Michigan – Flint has the highest rate of $2,148.

Some benefits would help the cost of attending these schools. Scholarships and financial aid would assist tremendously at some universities. Kendall College of Art and Design of Ferris State University and Northern Michigan University both lend their students computers to omit the cost outside of tuition fees.

Tuitions rates will continue to fluctuate throughout the various universities and each student’s payment will vary based on different qualifications.


MLive database: A place to find salaries near you

Many people look into salaries when looking for a  job or picking a career to choose in college. MLive database of state employee salaries is a great data set to look at when gathering information about all of the salaries for state of Michigan employees.

This database provides all the  information you would need when looking into salaries, and  the database narrows it down to only Michigan. It’s better then giving you an average salary in general.

MLive is based on salaries in Michigan but does not include any other benefits. This website is made very simple for people to use. All you have to do is type in a name and click the employee you are looking for or you could simply click on the job title you want and it will show you the amount that position makes.